By Vidnyan Sawant, AVP - technical research at GEPL Capital
The recent price action in the Nifty index has been quite intriguing. It has shown resilience by finding strong support around the 19,230 level, which coincides with the lows of the past couple of months. This rebound indicates a notable demand for the index at lower price levels.
On a weekly basis, the Nifty index has formed a higher high higher low pattern, which is typically associated with a bullish trend. Additionally, it has maintained its position at the previous five weeks' high, further supporting the idea of a bullish trend.
Analyzing the daily charts, the index has remained above its 20-day simple moving average (SMA) and has broken out of a downward-sloping channel pattern. This breakout is a positive sign and suggests a strong positive sentiment surrounding the index.
The relative strength index (RSI), a momentum indicator, has been moving upward and has consistently stayed above the 60 mark on the daily charts. This indicates a strengthening positive momentum for the index in the short term.
Considering these factors, it seems that the Nifty Index is currently in a positive trend and has the potential to move towards the 19,991 levels in the short to medium term. However, it's important to monitor the 19,430 level as a breach below it could negate this bullish view.
Here are three buy calls for next 2-3 weeks:
Latent View Analytics: Buy | LTP: Rs 455.75 | Stop-Loss: Rs 435 | Target: Rs 505 | Return: 11 percent
After its downturn starting in July 2021, the stock has now solidified a base, oscillating between Rs 320 and Rs 420. Recent trends reveal a positive momentum with the stock charting continuous higher highs and lows.
Significantly, the stock has broken through this consolidation zone, surpassing Rs 420 mark. This breakout, backed by rising trading volumes, points towards the initiation of an upward trend, aptly depicted by the Rectangle pattern transition.
Consistently, the stock has maintained its position above the 12-week exponential moving average (EMA), reinforcing its bullish stance.
In alignment with this upward trend, the MACD (moving average convergence divergence) momentum indicator showcases a positive crossover reflecting presence of positive momentum.
Going ahead we expect the prices to move higher till Rs 505 where stop-loss must be Rs 435 closing basis.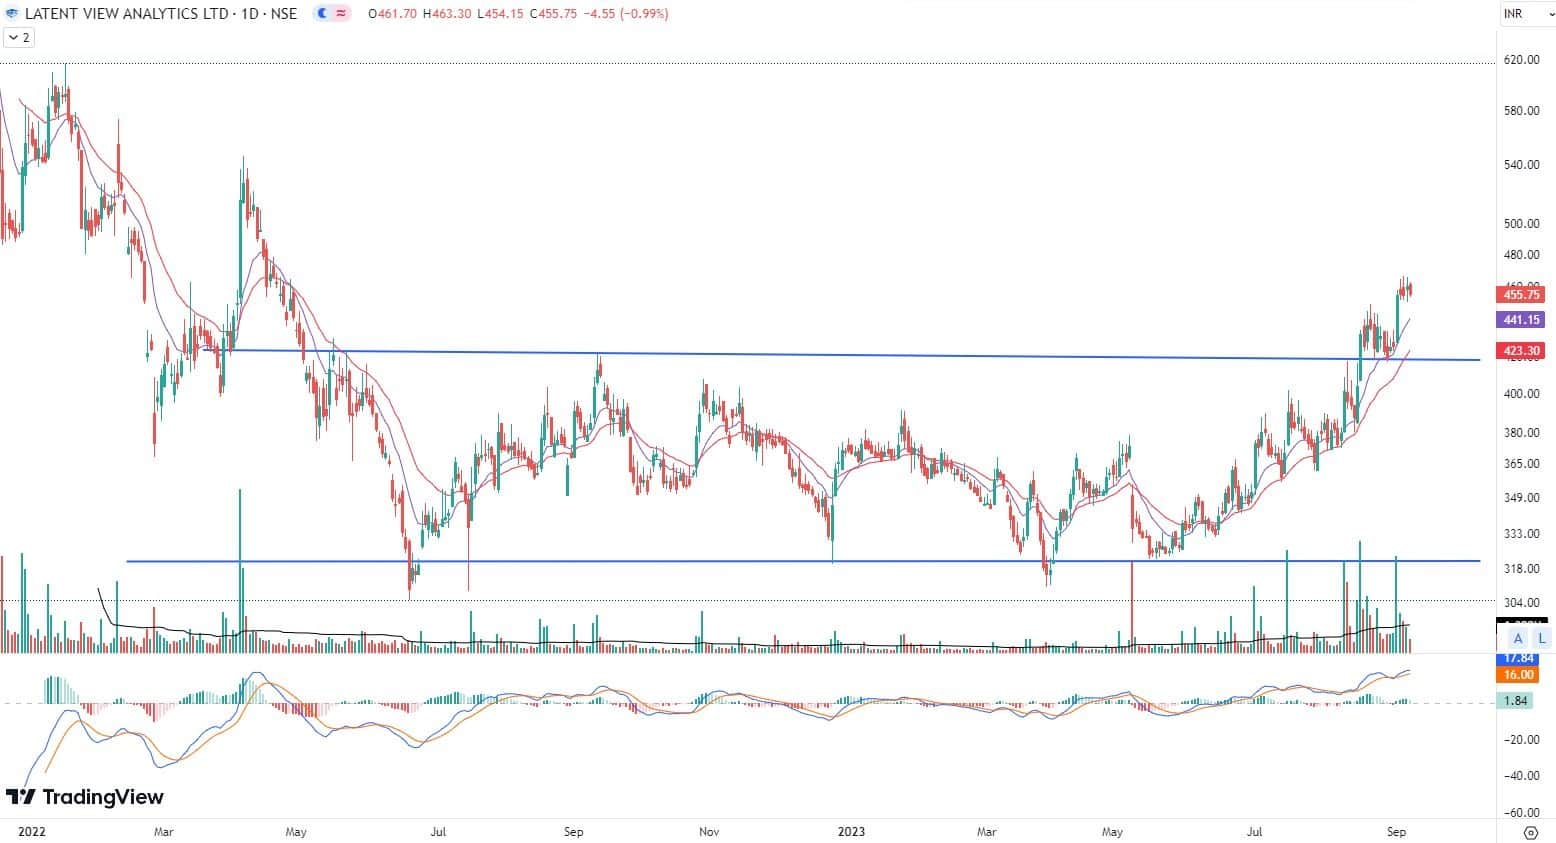
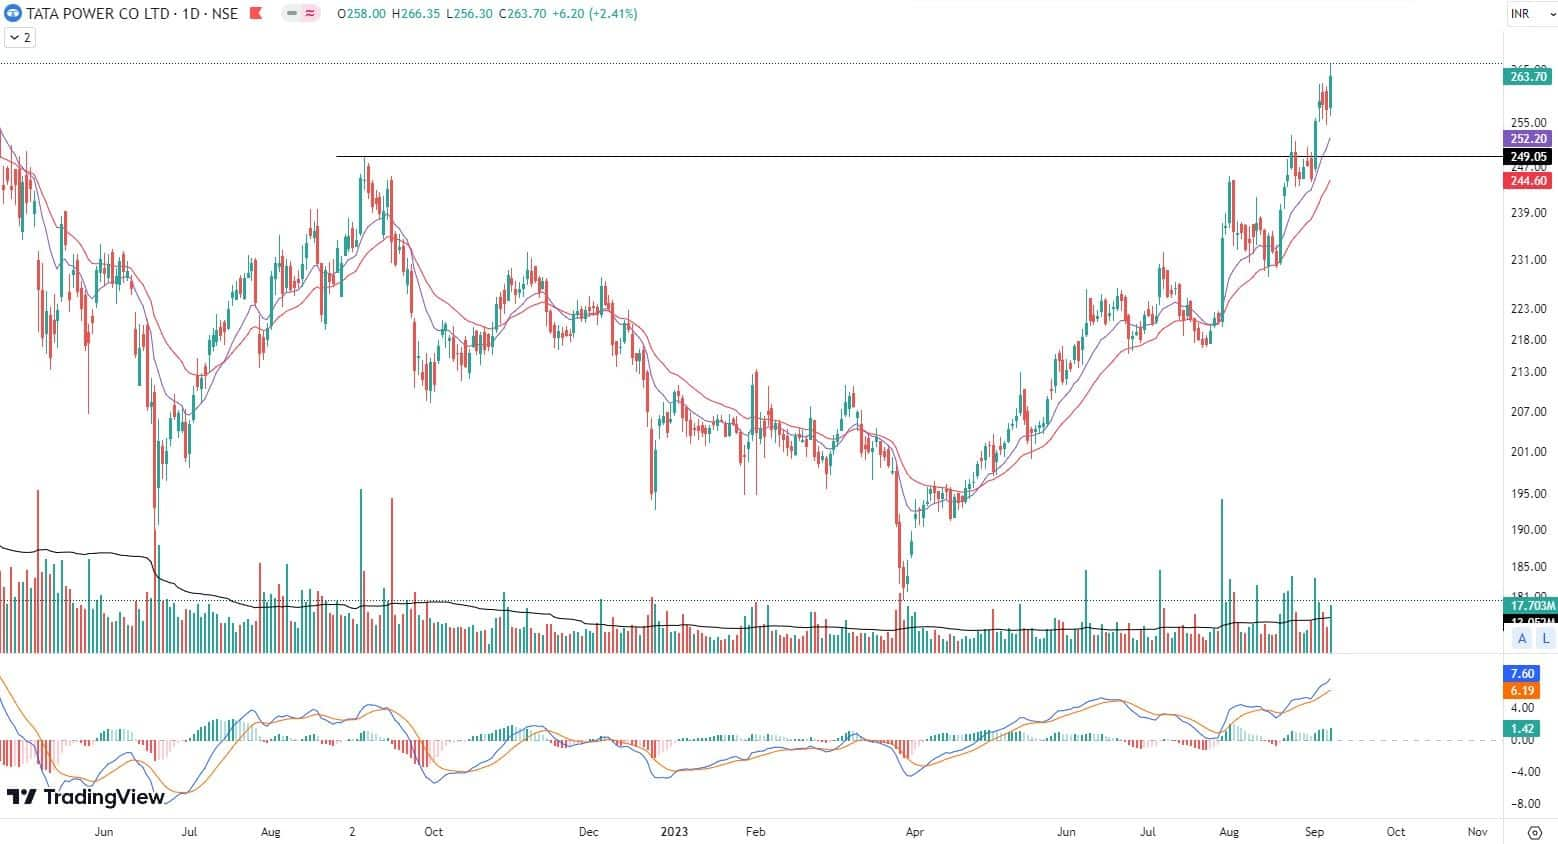
Tata Power Company: Buy | LTP: Rs 263.70 | Stop-Loss: Rs 252 | Target: Rs 292 | Return: 11 percent
Tata Power showcases a consistent pattern of higher highs and higher lows, supported by an escalating volume trend, hinting at a substantial buildup driving the prices.
In early September 2023, the stock notably broke through the rounding bottom pattern, signaling the onset of an upward trajectory. Currently, its trading stance above both the 12 & 26 days EMA (exponential moving average) solidifies its bullish trend.
Further endorsing this positive outlook, the MACD has registered a positive crossover, emphasizing the prevailing upward momentum.
Going ahead we expect the prices to move higher till Rs 292 where stop-loss must be Rs 252 closing basis.
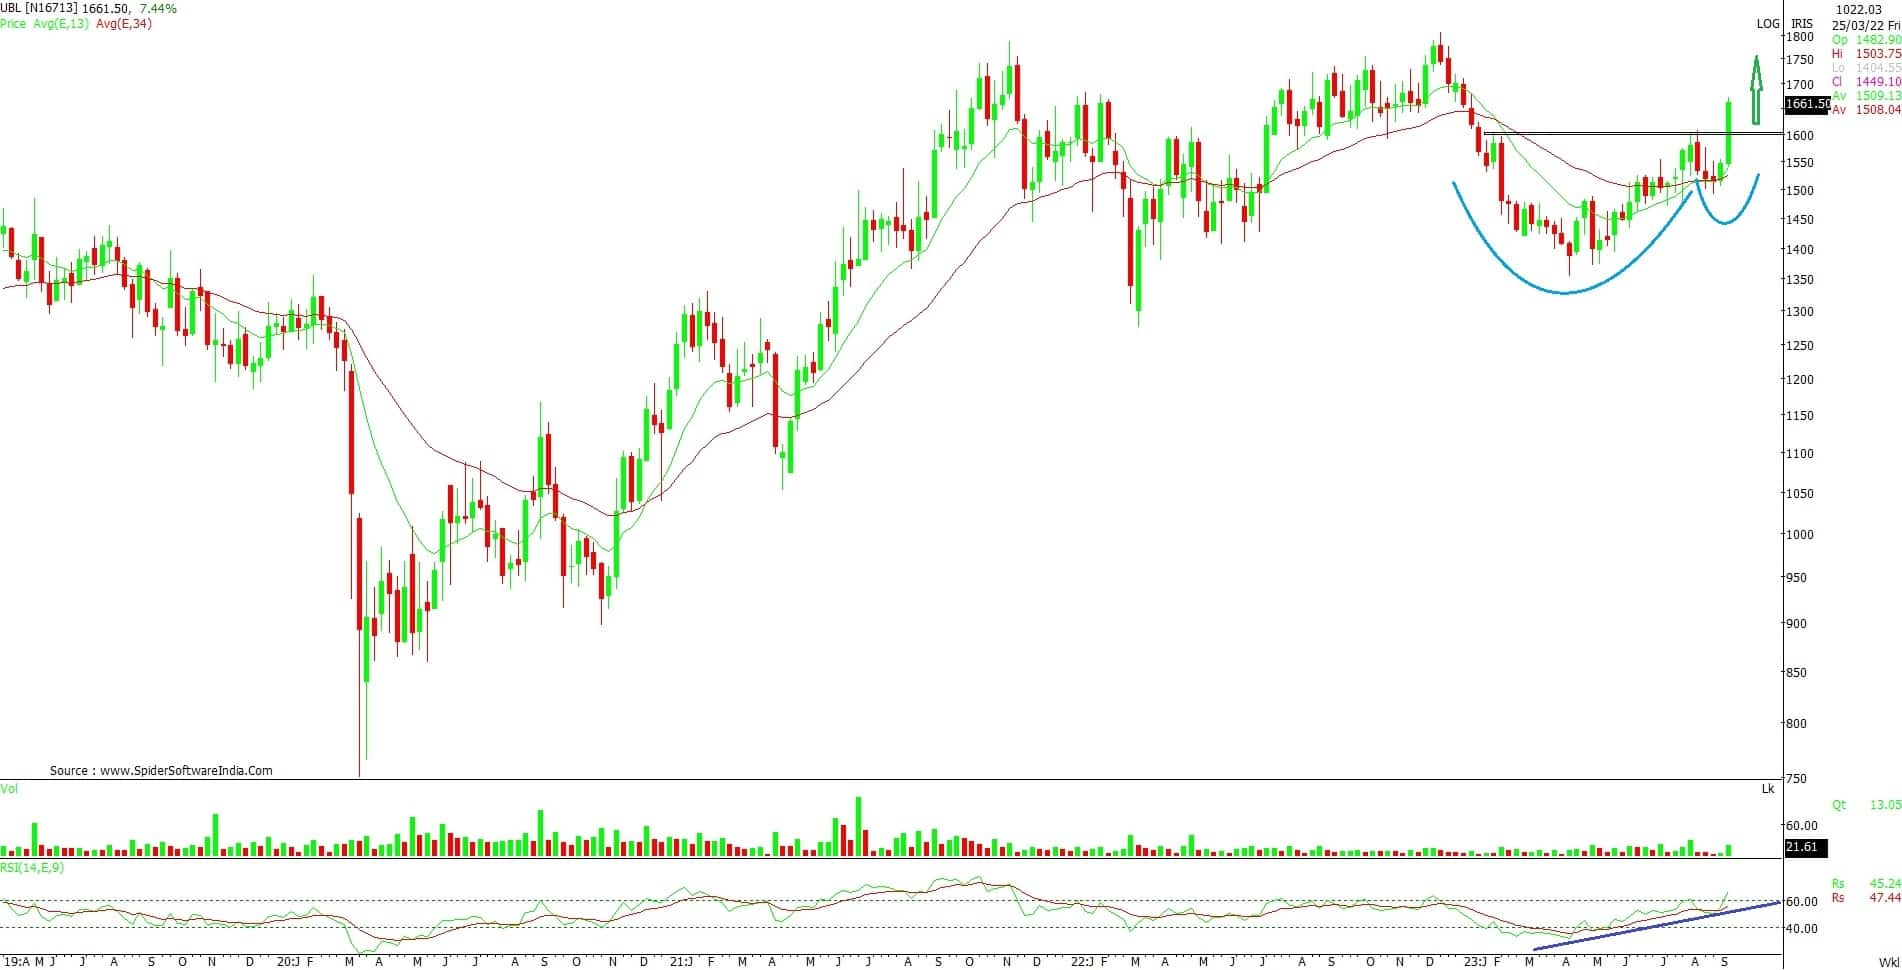
United Breweries: Buy | LTP: Rs 1,662.35 | Stop-Loss: Rs 1,590 | Target: Rs 1,825 | Return: 10 percent
UBL stock recently exhibited a Double Top pattern around Rs 1,800 level in December 2022, followed by a correction that led to a bottom around Rs 1,350. Subsequently, it embarked on an upward trajectory, forming higher tops and higher bottoms. Currently, the stock is trading at a six-month high, indicating a positive sentiment for the medium to long term.
In addition to this, recent market activity has revealed a breakout from a Cup & Handle pattern, supported by significant trading volume, further confirming the ongoing uptrend. Moreover, the daily charts have displayed a notable breakout from a Symmetrical Triangle pattern, reinforcing the stock's optimistic outlook.
Furthermore, both the weekly and daily relative strength index (RSI) indicators are showing upward trends and are holding above the 65 level. This indicates substantial positive momentum in the stock's price movement.
Considering these technical indicators, the expected price movement suggests that the stock may advance towards Rs 1,825 price level. To effectively manage risk, it is advisable to establish a prudent stop-loss level at Rs 1,590 on a closing basis.
Disclaimer: The views and investment tips expressed by investment experts on Moneycontrol.com are their own and not those of the website or its management. Moneycontrol.com advises users to check with certified experts before taking any investment decisions.

Discover the latest business news, Sensex, and Nifty updates. Obtain Personal Finance insights, tax queries, and expert opinions on Moneycontrol or download the Moneycontrol App to stay updated!