The market recorded half-a-percent gains on September 8 and continued its upward journey for the sixth straight session. The Nifty50 rallied from the 19,250 to the 19,820 levels in those six days, which was outstanding. Hence, 19,900 is expected to be an immediate resistance for the index, followed by the 20,000 milestone, with crucial support at the 19,700-19,500 area, experts said.
The Nifty50 surged 93 points to 19,820, and the BSE Sensex rallied 333 points to 66,599, while the Nifty Midcap 100 and Smallcap 100 indices gained nearly 1 percent and six-tenth of a percent last Friday, continuing the uptrend for 10 days in a row.
The Bank Nifty climbed above the 45,000 mark, rising 278 points to 45,156, while there was a minor correction in Nifty IT, which fell 33 points to 32,416.
Stocks that reported healthy performance last Friday included Sobha, Sunteck Realty, and CDSL (Central Depository Services). Sobha has seen a decisive breakout of falling resistance trendline adjoining highs of July 26 and September 5, with strong bullish candlestick pattern on the daily charts. The stock rallied nearly 11 percent to Rs 682 and formed significantly higher volumes.
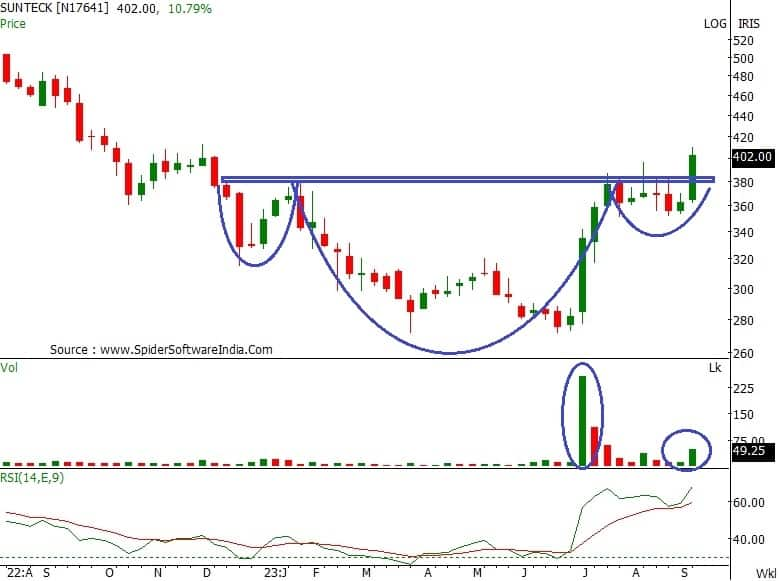
Sunteck Realty, too, has seen a strong breakout of downward sloping resistance trendline adjoining highs of August 9 and September 7, with healthy bullish candlestick pattern on the daily scale. The stock rose 7 percent to Rs 401, with strong volumes.
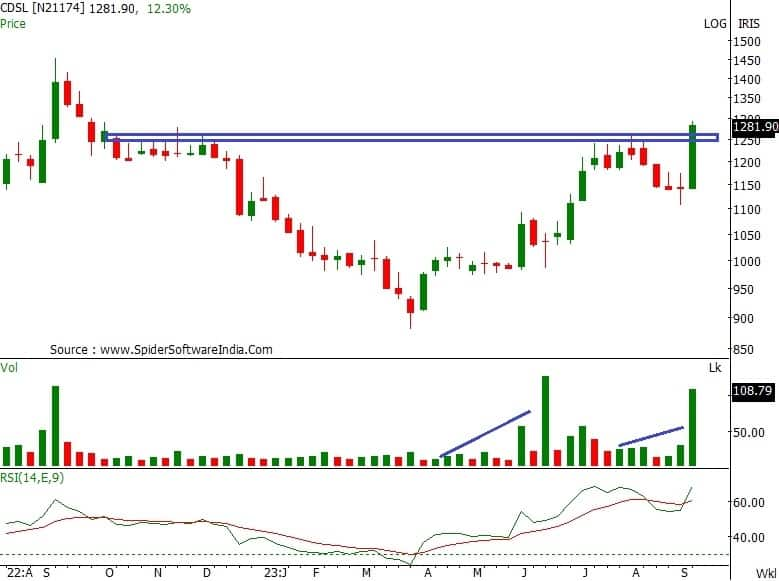
CDSL also has seen a breakout of horizontal resistance trendline adjoining multiple touchpoints, with healthy volumes. The stock traded above all key moving averages and jumped 6.6 percent to Rs 1,282, forming robust bullish candlestick pattern on the daily timeframe.
Here's what Rajesh Palviya of Axis Securities recommends investors should do with these stocks when the market resumes trading today:
On the weekly time frame, the stock has confirmed an "Inverse Head & Shoulder" - a short term trend reversal pattern indicating bullish sentiments. This breakout was occurred at Rs 645 levels on a closing basis. This breakout is accompanied with huge volumes indicating increased participation.
The stock is well placed above its 20, 50, 100 and 200-day SMA (simple moving average) which reconfirmed bullish trend. Since past 5-6 months the huge rising volumes signifies come back of bulls.
The stock is in strong uptrend forming a series of higher tops and bottoms across all the time frames. The daily weekly and monthly RSI (relative strength index) is in positive terrain and quoting above 50 mark indicating sustained strength.
Investors should buy, hold and accumulate this stock with an expected upside of Rs 750-840, with downside support zone of Rs 620-590 levels.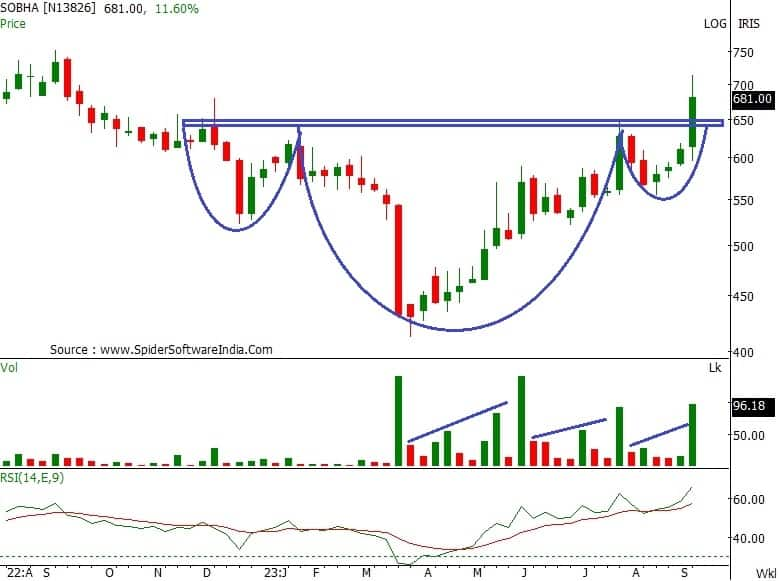
On the weekly time frame, the stock has confirmed an "Inverse Head & Shoulder" - a short term trend reversal pattern indicating bullish sentiments. This breakout was occurred at Rs 385 levels on a closing basis. This breakout is accompanied with huge volumes indicating increased participation.
The stock has experienced trend reversal on the daily and weekly time frame indicating bullish sentiments. The stock is well placed above its 20, 50, 100 and 200 day SMA which reconfirms bullish sentiments. The daily weekly and monthly RSI is in positive terrain indicating positive bias.
Investors should buy, hold and accumulate this stock with an expected upside of Rs 475-520, with downside support zone of Rs 385-360 levels.
With current week's gain, the stock has experienced one year "multiple resistance zone breakout at Rs 1,255 levels on a weekly closing basis. Huge volumes on this breakout signifies increased participation.
The stock has recaptured its 20 and 50-day SMA and rebounded sharply indicating positive bias. The daily weekly and monthly RSI is in positive terrain indicating positive bias. The daily "band Bollinger" buy signal suggests increased participation.
Investors should buy, hold and accumulate this stock with an expected upside of Rs 1,385-1,450, with downside support zone of Rs 1,230-1,200 levels.
Disclaimer: The views and investment tips expressed by investment experts on Moneycontrol.com are their own and not those of the website or its management. Moneycontrol.com advises users to check with certified experts before taking any investment decisions.
Discover the latest business news, Sensex, and Nifty updates. Obtain Personal Finance insights, tax queries, and expert opinions on Moneycontrol or download the Moneycontrol App to stay updated!